
We are undergraduates from the National School of Statistical Sciences of the Brazilian Institute of Geography and Statistics (ENCE/IBGE). In 2024, we were enrolled in an extension project with other 5 undergraduates and advised by three ENCE teachers. The extension project was entitled Statistical Education as an ally for the development of critical thinking. For 6 months, our extension group worked hard to connect the statistical fundamentals (required by the National Curriculum for Middle School in Brazil) with real problems contemplated by the SDGs. The key idea was to awaken interest in data and data analysis in students from those grades. We wanted to show them Statistics is not ‘rocket science’, but a powerful tool to understand and transform the world.
The Project – the creation of Datalia
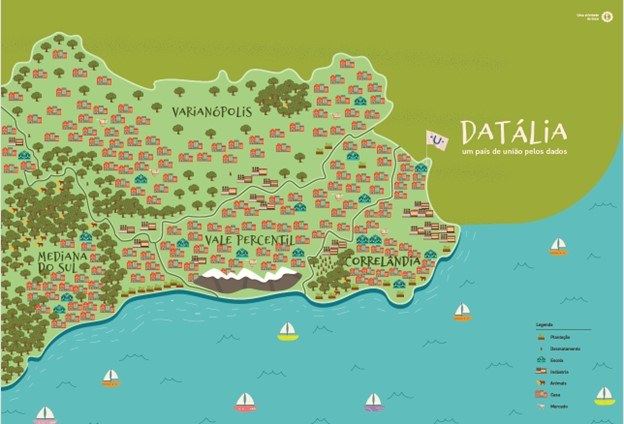
Inspired by the need to develop the statistical literacy of young students from the 6th grade of Middle School, we created a fictional country: Datalia. The country had problems like those in the real world: hunger, gender inequality, industrial pollution, lack of access to quality education, and deforestation. The country had 4 regions: Correlandia, Varianopolis, Vale Percentil and Mediana do Sul (names of the regions were inspired by statistical concepts). Students were challenged to play the role of statisticians to help the president of Datalia make wise decisions for the people.
The mission? Help the president of Datalia to identify the problems of each region and provide ideas for solutions, using data relative to SDG indicators.
The activity
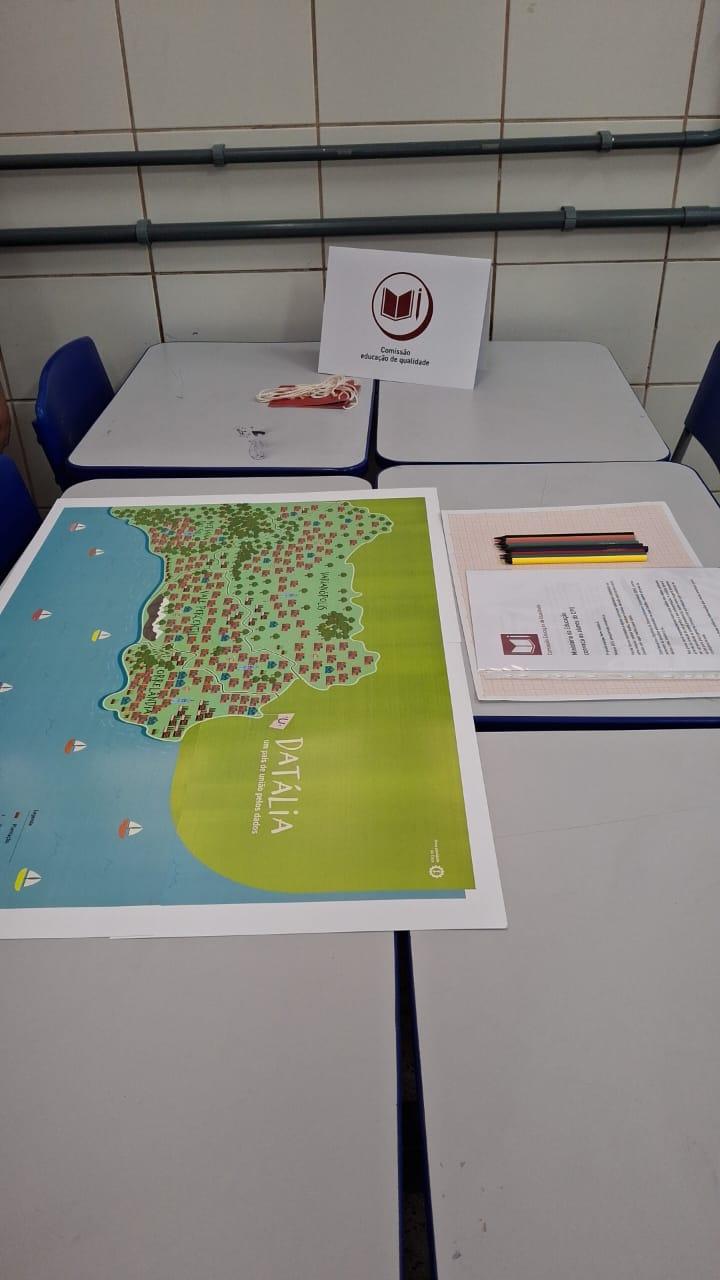
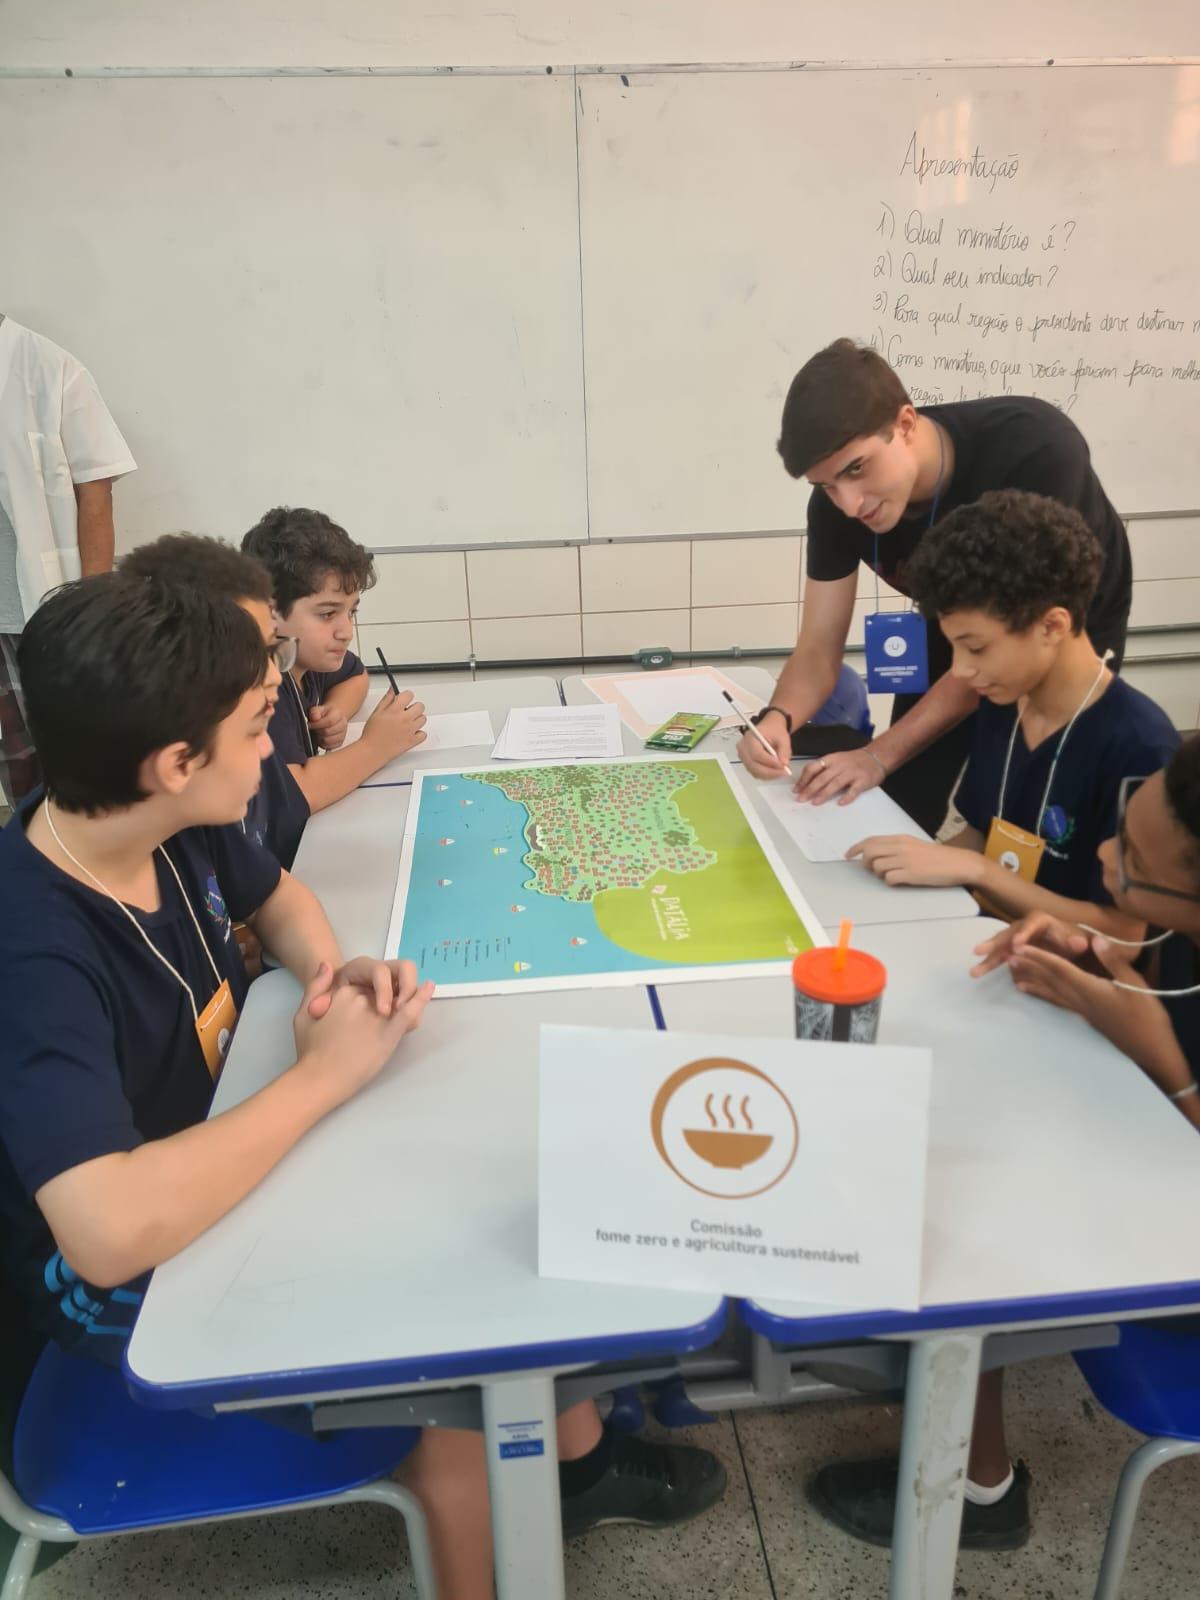
The activity was conceived to involve students in each stage of the data analysis process. Students started collecting data from the map of Datalia (Figure 1). Each symbol on the map could be counted to feed the calculus of the SDG indicators. For example, to calculate indicator 9.4.1, Emission per unit of value-added, students had to count the symbols of industries on the map. In addition to the map, there were portfolios (See Figure 2 to check the set of activity materials). They had details about the regions as well as statistics necessary for the calculus of SDG indicators. For the same indicator, students were informed about the GDP of each region and about geographical and populational characteristics (contextual information). With all that information they were both able to calculate the indicator and identify the problems, as well as confront those statistics with context to propose solutions.
Students then experienced three main stages:
- Collect and organize data: an exercise of interpretation and organization of information;
- Calculate indicators and elaborate graphs: a practice of statistical analysis from accessible concepts;
- Provide ideas for decision-making based on data: students presented solutions based on the insights they had during the experience.
Students worked with the following SDG indicators.
- 2.1.1 Prevalence of undernourishment
- 4.1.1 Proportion of children and young people in grades 2/3; at the end of primary; and at the end of lower secondary achieving at least a minimum proficiency level in (i) reading and (ii) mathematics
- 5.5.1 Proportion of seats held by women in national parliaments and local governments
- 9.4.1 Emission per unit of value added
- 15.1.1 Forest area as a proportion of total land area
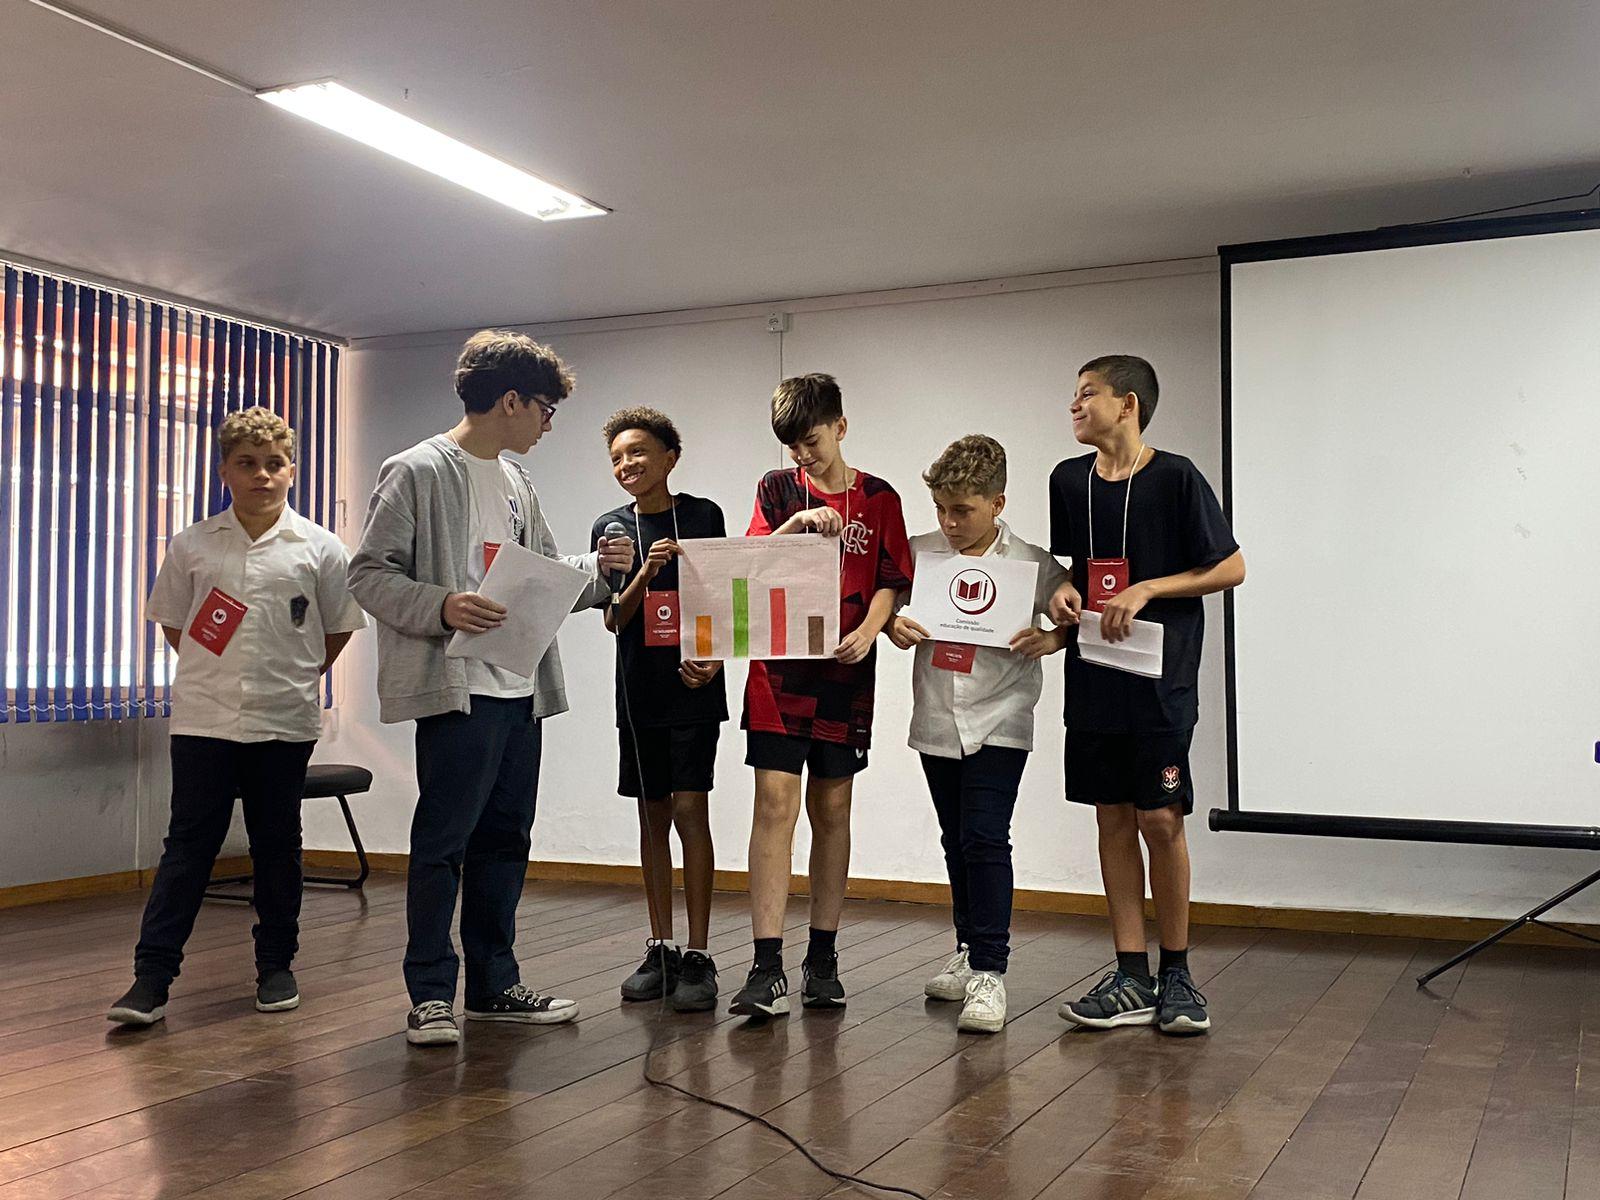
They worked in groups, which represented the Ministries responsible for each indicator: Agriculture, Education, Human Rights and Citizenship, Industry and Trade, and Environment (See Figure 3). They calculated indicators for the 4 regions of Datalia, and then elaborated a comparative graph. Using these statistics and contextual information, they were able to identify problems and suggest solutions for the president to make the best decisions for the good of the people in Datalia. For that, students presented data and their ideas on a stage before colleagues and teachers (Figure 4). During all the group work, students were assisted by undergraduates, who, in turn, were monitored by the three ENCE advisors.
SDGs in practice: a transformative experience
By associating SDG indicators to Datalia, we got something incredible: 12-year-old children started understanding, in a practical way, how data can help solve global problems. Even with little experience in statistics, the students were able to interpret graphs, calculate indicators and suggest viable solutions for the challenges they encountered.[1]
This approach shows that SDGs can be taught from early ages, as long as activities are adapted to both students’ age and level of experience in statistics. The experience demonstrates that statistics, when presented in a creative and practical way, comes from abstract to make sense to students.
Lessons learned and next steps
This Extension Project on Statistical Education showed us that it is possible to teach statistics and SDG indicators in a meaningful way even to very young students. A ludic and practical approach makes us reflect on how data help identify problems more precisely and search for solutions fit to the context.
Next year, we intend to continue and expand the project, making the learning experience even more immersive and reaching a bigger number of students. We understand that data literacy and SDG understanding are essential tools to transform young people into critical citizens more prepared for the global challenges.
And you? Have you thought how to use SDG indicators in a practical and ludic way to educate?
Special credits to
Advisors
Renata Souza Bueno (Ence teacher and project coordinator)
Bianca Walsh (Ence teacher and translator of the original Portuguese blog text into English)
Larissa de Carvalho Alves (Ence teacher)
Undergraduates directly involved in the conception and implementation of the project
Laira Zopellaro Machado Miranda Ferreira
Mateus de Morais Gomes
Victor Martins Quirino
Julia Neotti do Nascimento
Designer of learning material
Priscila Alexandre Freire
[1] Activities included an approximation of the calculus of the original indicators.
About the authors
Laira Zopellaro Machado Miranda Ferreira, Statistics student, ENCE. Laira is a 21-year-old student in the 7th semester of graduation in Statistics at the National School of Statistical Sciences (ENCE) in Rio de Janeiro, Brazil.
Mateus de Morais Gomes, Statistics student, ENCE. Mateus is a 21-year-old student in the 5th semester of graduation in Statistics at the National School of Statistical Sciences (ENCE) in Rio de Janeiro, Brazil. He is currently an intern in Financial Planning at the company Vibra Energia.
Related

How the BuildSkills Academy is constructing a sustainable future
Microlearning
![]() Blog
Blog
Offered by:
Ms. Isabela Carrozza Joia (Program Associate, SDG Academy, UNSDSN)
Equipping Youth with Skills & Agency to Shape Policies for a Sustainable Future
Microlearning
![]() Blog
Blog
Offered by:
Kayla Colyard (Education Manager, SDG Academy - UN Sustainable Development Solutions Network (SDSN)), Patrick Paul Walsh (Director, SDG Academy - UN Sustainable Development Solutions Network (SDSN))
Teach the Future’s NGFP-YV Awards: Youth Foresight in Action
Microlearning
![]() Blog
Blog
Offered by:
Ms. Lisa Giuliani (Executive Director of Youth Foresight Projects, Teach the Future), Ms. Lourdes Rodriguez (Executive Director Hubs Network, Teach the Future), Ms. Amna Habiba (Director of Technology and Young Voices Network, Teach the Future)
Banking on Biodiversity: The Seed Savers’ Crusade
Microlearning
![]() Podcast
Podcast
Offered by:
Dr. Stefan Schmitz (Executive Director of the Crop Trust),
HCP's experience in developing and implementing an e-learning strategy
Microlearning
![]() Blog
Blog
Offered by:
Samir Issara (Director of Human Resources and General Affairs, High Commission for Planning of Morocco (HCP))